
AWS Cost Monitoring with Rill
A lightweight dashboard for AWS cost monitoring using Rill for AWS CUR data

If your finance team asked you tomorrow if there’s more you could do to cut AWS costs, what would you say? Be honest.
Everyone knows they should be doing a better job monitoring AWS costs. Almost nobody actually does. It’s not for lack of interest:even basic tools like AWS Cost Explorer make it surprisingly hard to understand what’s going on, especially once usage grows beyond a small setup.
At Twing Data, set out to build something dead simple: point a dashboard at S3, automatically ingest AWS Cost and Usage Report (CUR) files, and instantly get a useful set of dashboards. We wanted to avoid complex modeling, configuration, various ingestions and transformations, etc. The goal was to keep it as simple as possible so you can quickly see where your money is going, how it’s trending, and where to dig deeper.
We’ve gotten to know the Rill team from working with them on some projects and thought they’d be a great fit for this.
What you get out of the box
With this setup, you get a working cost dashboard almost immediately:
Automatic ingestion and partitioning of AWS Cost and Usage Report (CUR) data from S3
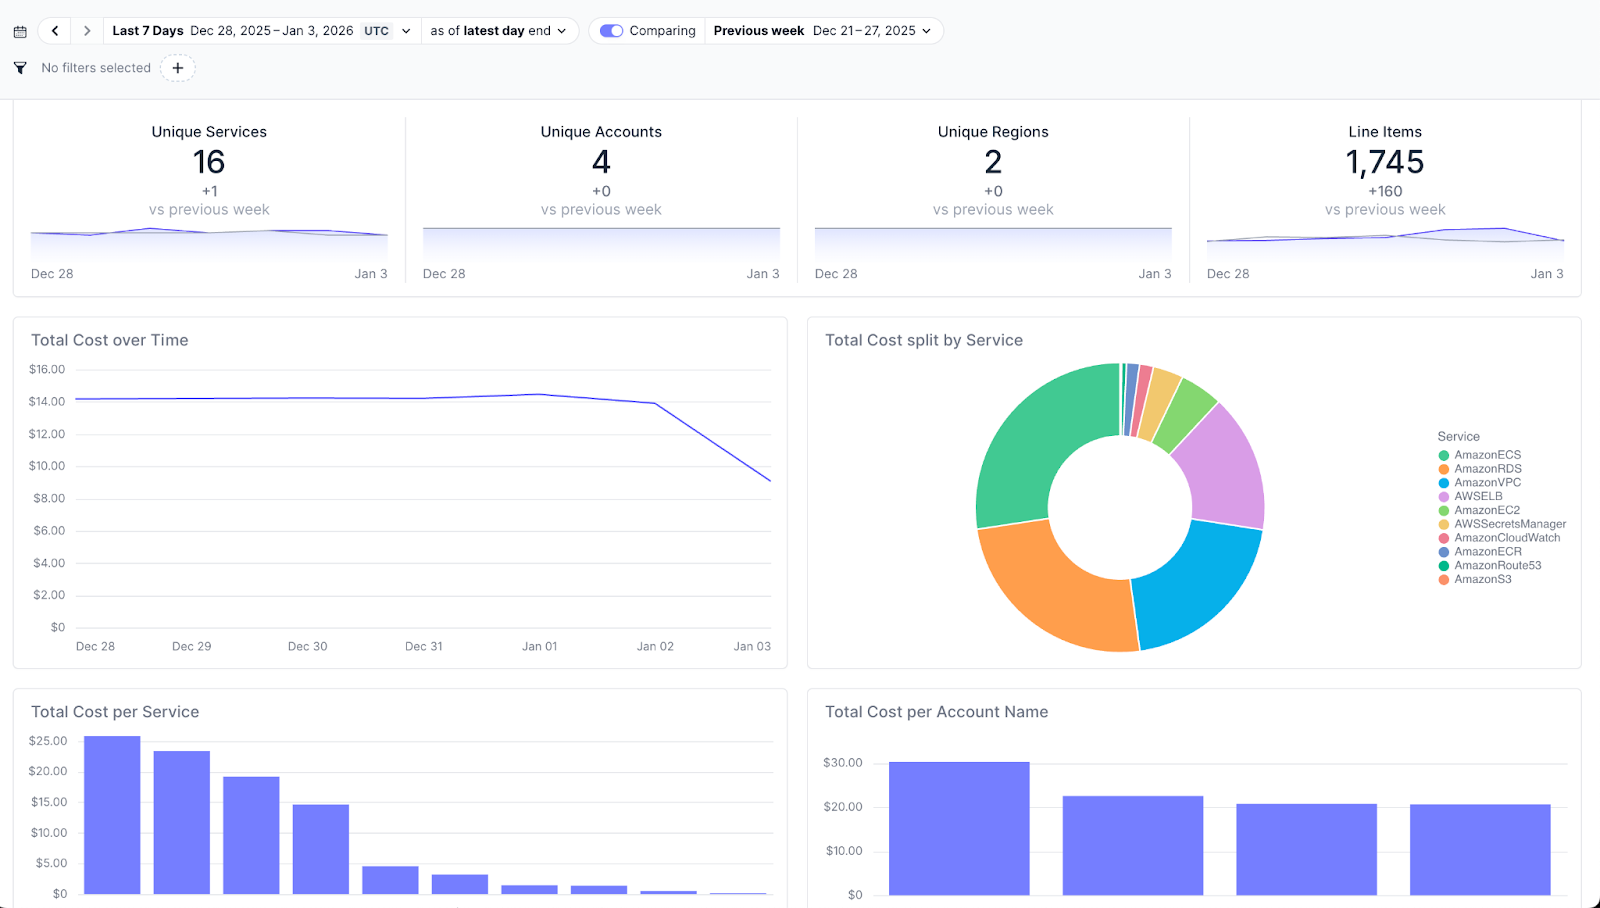
Default dashboards showing cost trends and breakdowns
Fast slice-and-dice without writing SQL
An AI chat layer for ad-hoc questions and analysis
The goal is to give a V1 of a robust cost monitoring system that gives you a clear, usable snapshot of costs with minimal effort and then lets you go deeper if and when you need to.
Why Rill works well here
A few core Rill features do most of the heavy lifting:
Automatic ingestion from S3: Point Rill at your CUR bucket and it handles loading new files as they arrive.
Partition-aware updates: New cost files are ingested incrementally on a schedule, so the dashboard stays current without reprocessing everything.
ClickHouse under the hood: This scales far beyond “toy demo” size. You can throw very large CUR datasets at it without worrying about performance. Rill also provides a nice way to test changes on “dev” before pushing them to production.
Getting started
Note: If you do not already export your Cost and Usage Reports to a bucket follow this quick setup.
In console search for `Billing and Cost Management` > `Data Exports`
Select Create
Legacy CUR export
Include resource IDs
Refresh automatically with your expected cadence Hourly, Daily, Monthly
Configure the bucket to share with Rill
The repo lives here: https://github.com/Twing-Data/aws-cost-dashboard
The setup is deliberately minimal:
Clone the repo
Configure your .env file with AWS and S3 settings
Run rill start
Or in code:
Install rill if you don’t have it:
curl https://rill.sh | sh
git clone https://github.com/Twing-Data/aws-cost-dashboard.git
cd aws-cost-dashboard
rill start
That’s it. Once Rill starts, it ingests the data and serves the dashboard locally.
Defaults first, simple customization
The dashboards are built on top of standard AWS CUR fields so they’re useful right away. In practice, most teams tag their resources to provide more visibility and measurement across applications, teams, environments, and projects.
Rill makes this easy to extend: you modify the YAML files in the sources, metrics, and dashboards folders:
Define new fields in the source
Reference them in metrics
Use them in dashboards
Once added, those fields are immediately available everywhere. Rill avoids the complex overhead of complex modeling or orchestration and quickly gives you a useful dashboard. You can read more docs here to see it in action and all the options Rill offers: https://docs.rilldata.com/build/dashboards
Augmenting with AI
Everyone is incorporating AI into their products and Rill is no exception. Rill includes an AI chat layer that lets you ask questions directly against the dataset. The nice thing is that because it’s tightly integrated with the rest of the platform you get dashboards that link back to the original data sources so you can verify the numbers, a good way to handle the hallucination risk and AI audit trail.
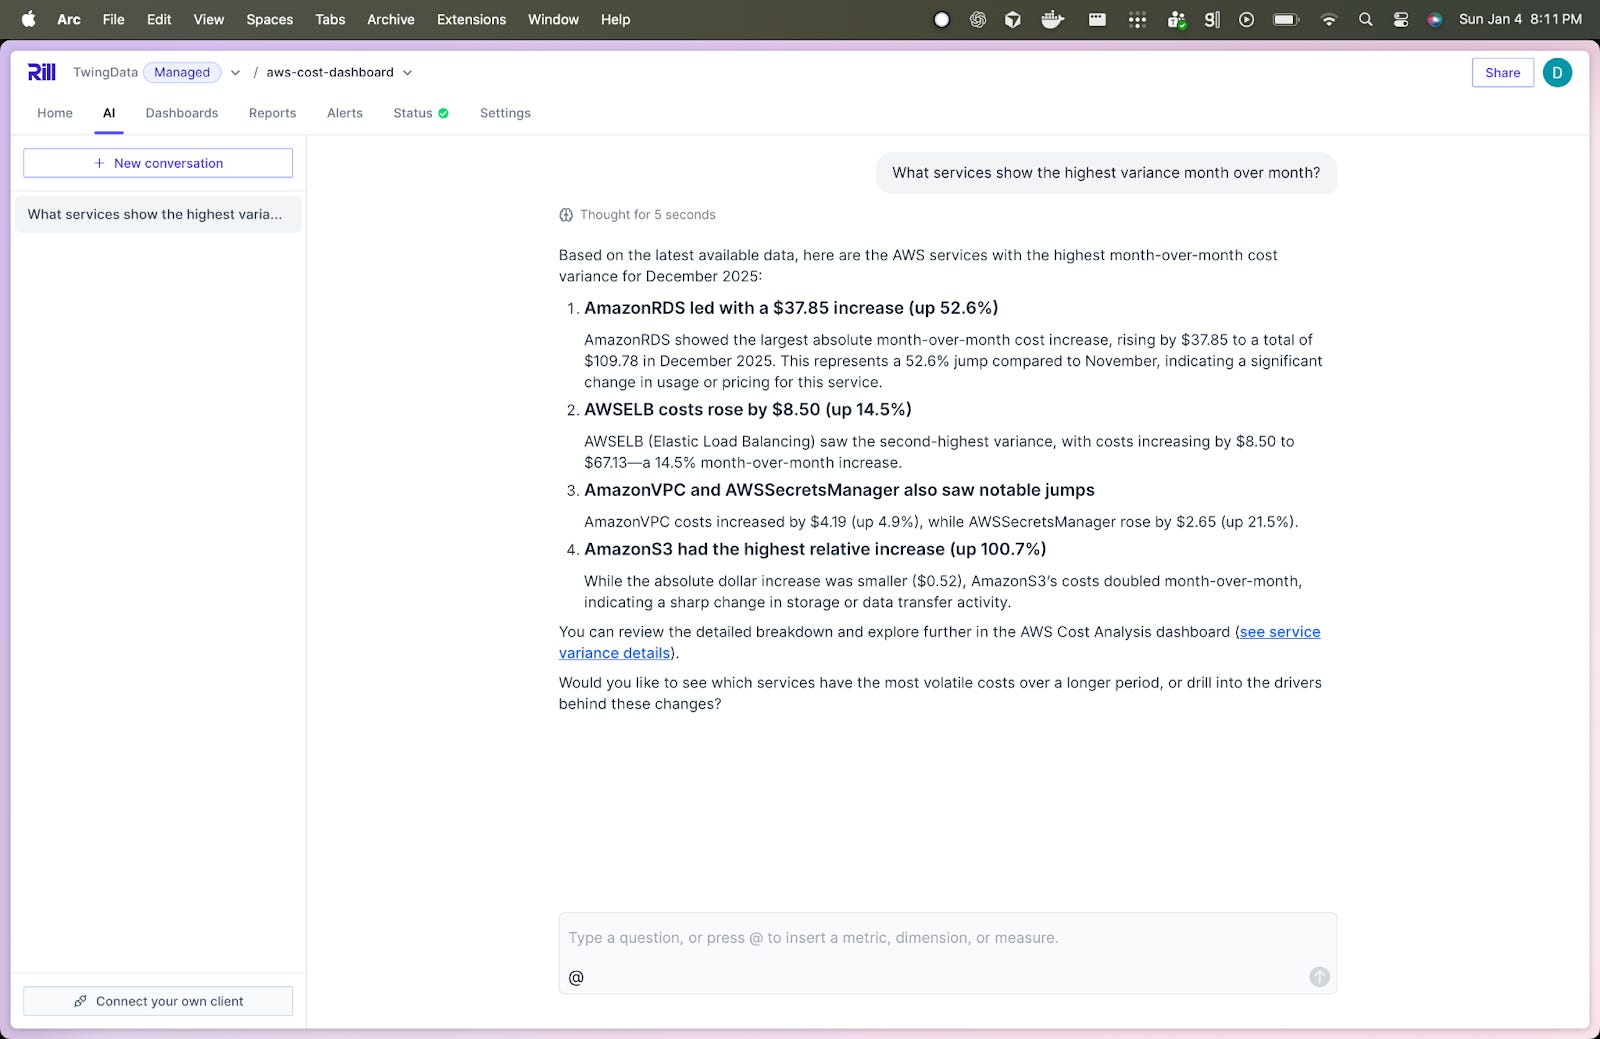
You can also do things like select a portion of the chart that has noisy or interesting data and ask Rill to do a root cause analysis.
This project was about minimizing setup cost while still delivering something useful. You can be up and running quickly, get useful visibility into AWS costs, and still have a path to deeper analysis and customization as needs grow.
If AWS cost monitoring has felt heavier than it should be, this is a much lighter starting point. Let us know if you end up giving it a try.